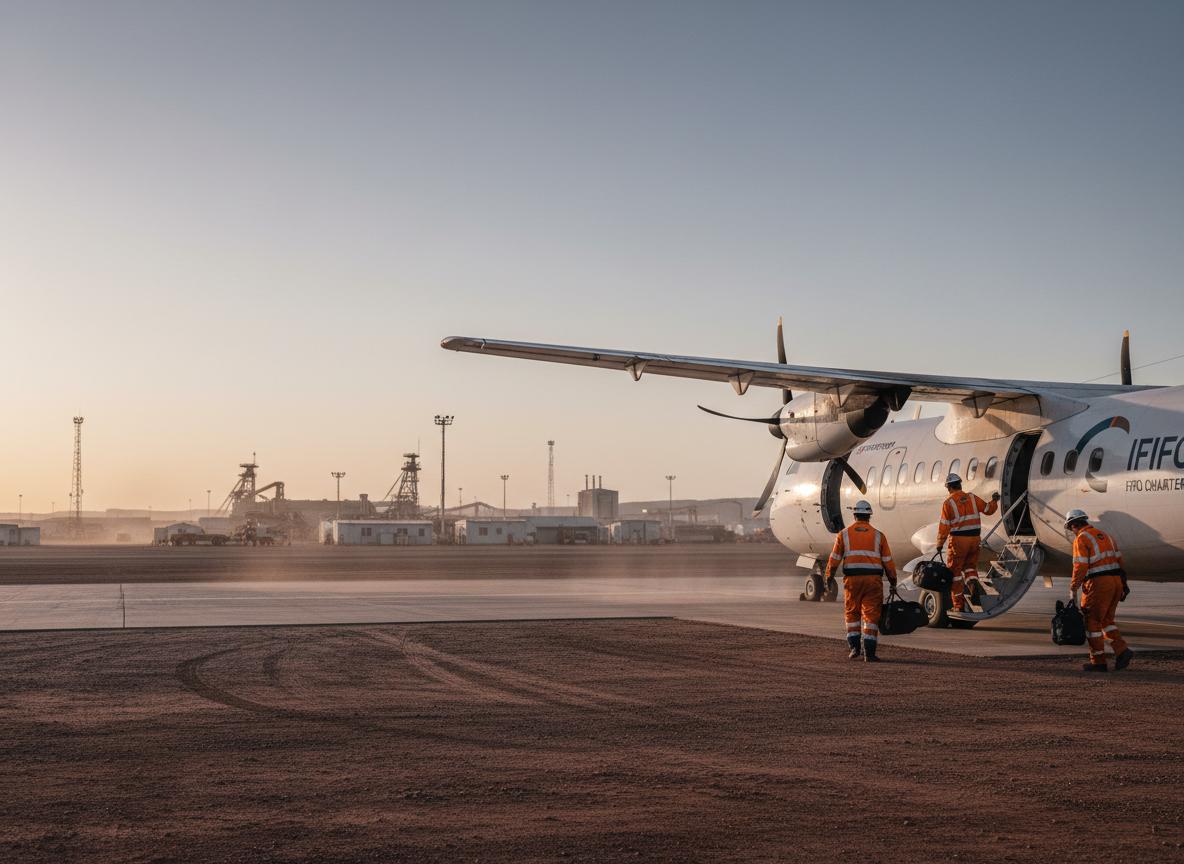
The true cost of fly-in-fly-out operations extends far beyond airfare. A comprehensive analysis of FIFO logistics reveals that transportation represents only part of total rotational deployment costs, with accommodation, productivity impacts, and retention factors contributing substantially to the total cost of ownership.
Beyond the Airfare Calculation
Traditional FIFO cost analysis focuses on the visible expenses: charter aircraft or commercial tickets, ground transportation, and site accommodation. These direct costs are substantial and easily quantified. A typical FIFO worker can generate substantial annual transportation and accommodation expenses, depending on rotation frequency and site location.
But this narrow view misses the broader cost picture. Productivity impacts associated with travel fatigue, time zone adjustment, and separation from family support systems can reduce effective work capacity in the days following rotation. Across a large rotational workforce, this productivity drag represents substantial lost output annually.
Retention costs add another dimension. FIFO work arrangements experience higher turnover than conventional employment, a pattern common in the mining sector. Each departure triggers recruitment, training, and productivity ramp-up costs that can be substantial for each worker. Even a modest reduction in turnover generates substantial savings.
"The cheapest flight is the one you don't have to book because you retained the worker who was already trained and productive."
Rotation Cycle Optimization
The rotation cycle — the pattern of work days on-site followed by rest days at home — represents the fundamental design decision in FIFO logistics. Common cycles include 2:1 (two weeks on, one week off), 3:1, 4:2, and 8:4 configurations. Each pattern creates different cost and experience trade-offs.
Shorter cycles reduce worker fatigue and improve work-life balance, but they increase transportation costs by requiring more frequent travel. A 2:1 cycle generates more travel sequences annually than a 4:2 cycle. The additional travel costs must be weighed against productivity and retention benefits.
Longer cycles reduce travel frequency but extend the period of family separation that drives dissatisfaction and turnover. The optimal cycle varies by workforce demographics, site location, and operational requirements. Leading organizations analyse worker preference data and retention patterns to identify cycle configurations that balance cost efficiency with experience quality.
Transportation Mode Selection
Charter aircraft provide the most efficient transportation for high-volume rotation periods, offering direct routing to remote airstrips and capacity that aligns with workforce movement patterns. But charter operations carry fixed costs that make them inefficient for lower-volume periods or smaller workforces.
Commercial aviation partnerships provide flexibility for variable demand, management travel, and overflow situations. Bulk booking agreements with airlines serving gateway cities secure preferential rates and inventory guarantees. The optimal transportation strategy typically employs a hybrid approach that charters for peak periods and uses commercial bookings for variable demand.
Ground transportation represents another optimization opportunity. Shared shuttle services from regional airports to site accommodation reduce per-worker costs compared to individual transfers. Fleet optimization models determine vehicle configurations and routing patterns that minimize cost while maintaining service quality.
Accommodation Economics
Site accommodation represents a large share of total FIFO costs, making it a significant optimization target. Camp operators typically charge daily rates that include lodging, meals, and basic amenities. These rates vary substantially based on camp quality, location remoteness, and contract terms.
Long-term camp contracts provide rate certainty and capacity guarantees but limit flexibility to adjust to changing workforce size. Short-term arrangements offer flexibility but at premium rates and with availability risk. The optimal contract structure depends on workforce stability and operational planning horizon.
Accommodation quality directly impacts retention. Workers who experience poor living conditions — overcrowded rooms, inadequate food, limited recreation — are more likely to seek alternative employment. Investment in accommodation quality generates returns through reduced turnover and improved productivity.
Productivity Impact Quantification
Travel fatigue measurably impacts worker performance in the days following arrival at site. Cognitive function, reaction time, and decision-making quality can all decline in the period after long-distance travel. For safety-sensitive roles in mining operations, these impacts create both productivity and risk concerns.
Progressive organizations implement arrival protocols that recognize these impacts. Light duty assignments on arrival days, extended rest periods, and wellness support services all help workers transition to full productivity more quickly. These interventions carry costs but generate returns through improved output and reduced safety incidents.
Retention as Cost Driver
Turnover represents one of the largest hidden costs in FIFO operations. Each departing worker triggers a cascade of expenses: recruitment advertising, screening and interviewing, background verification, onboarding training, and productivity ramp-up during the learning curve period.
Turnover costs per worker vary with role complexity and training requirements. Across a large FIFO workforce, annual replacement costs add up quickly, and even a small reduction in turnover generates meaningful annual savings.
The factors driving FIFO turnover are well understood: family separation, travel fatigue, accommodation quality, and limited recreation options. Addressing these factors requires investment, but the return on retention improvement typically exceeds the cost of intervention within the first year.
Total Cost of Ownership Framework
Comprehensive FIFO cost analysis requires a total cost of ownership framework that captures all cost categories: direct transportation and accommodation, productivity impacts, retention costs, and administrative overhead. This framework enables informed decision-making about rotation cycles, transportation modes, and accommodation investments.
TCO analysis typically reveals that the lowest direct-cost option is rarely the lowest total-cost option. A transportation mode with slightly higher per-trip costs might generate lower total costs through reduced travel time and associated productivity impacts. Similarly, accommodation investments that improve retention generate returns that far exceed their incremental cost.
Optimization Methodologies
Leading FIFO operations employ optimization methodologies that model cost trade-offs across multiple variables. Linear programming models identify transportation fleet configurations that minimize cost while meeting service requirements. Simulation models forecast the impact of rotation cycle changes on workforce satisfaction and retention rates.
Continuous improvement processes capture operational data and feed it back into optimization models. Actual travel times, accommodation costs, and turnover rates refine model parameters and improve forecast accuracy. This data-driven approach enables ongoing cost reduction while maintaining or improving service quality.
The calculation of FIFO logistics efficiency extends far beyond simple airfare comparisons. Organizations that master the comprehensive cost analysis and optimization methodologies gain competitive advantage through lower total costs, higher workforce retention, and improved operational continuity.